-
- 31 JUL
As Home Prices Rise, So Do Interest Rates
It was a jam-packed week, complete with a Fed rate hike, welcome news of cooling inflation, and more evidence that low housing inventory is impacting sales and appreciation. Here are the details:
Is the Latest Fed Rate Hike the Last? Inflation Moving Lower Step by Step Housing Supply “Critical to Expand,” Says NAR Home Prices Turning Higher Our Near-Term Rate ExpectationsIs the Latest Fed Rate Hike the Last?
In a unanimous decision, the Fed hiked their benchmark Fed Funds Rate by 25 basis points at their meeting last Wednesday, bringing it to a range of 5.25% to 5.5%.
This was the Fed’s eleventh hike since March of last year.
What’s the bottom line? In his press conference following the meeting, Fed Chair Jerome Powell was noncommittal regarding whether the Fed would hike at their next meeting on September 20.
The Fed will be closely monitoring economic data before making their rate decision in September, including a few reports that were released after their meeting last week. The first reading of second-quarter GDP showed that the economy grew at a stronger than-estimated 2.4% annualized pace, while the latest Jobless Claims figures continue to reflect strength in the labor market. As we have mentioned for the last several weeks, we are concerned that “base effects” may kick in and work against a continued decline in inflation. Particularly in July and August, as headline numbers in 2022 were 0.0% and 0.2% respectively.
Inflation Moving Lower Step by Step
June’s Personal Consumption Expenditures (PCE) showed that headline inflation increased 0.2%, while the year-over-year reading fell all the way from 3.8% to 3%. Core PCE, which strips out volatile food and energy prices, also rose by 0.2% in June with the year-over-year reading down from 4.6% to 4.1%.
What’s the bottom line? While inflation is falling, we are concerned that inflation may be bottoming, rather than making a straight line to the Feds target of 2%. Data in the coming months will provide more clarity.Housing Supply “Critical to Expand,” Says NAR

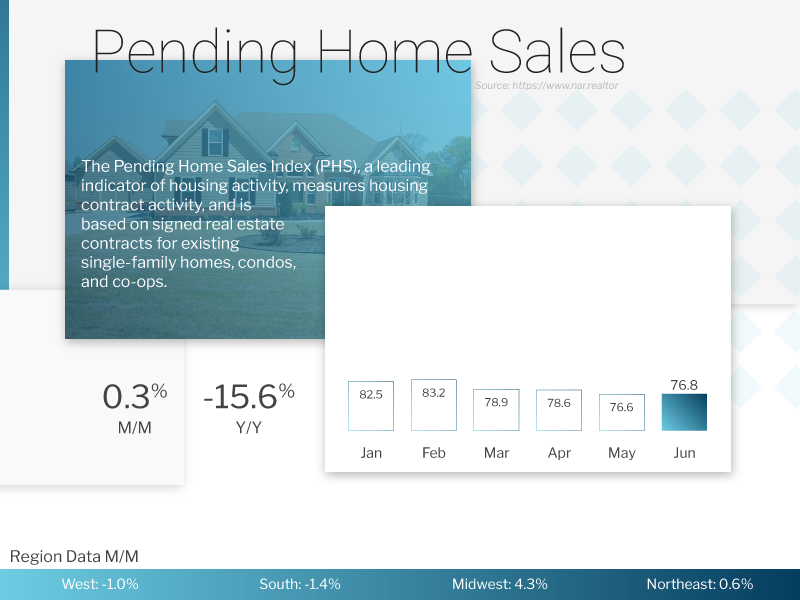
Pending Home Sales rose 0.3% from May to June, beating estimates and marking the first increase since February. While sales were down almost 16% from a year earlier, this correlates to the lack of inventory, which is about 14% lower over the same period. The data is considered a forward-looking indicator of home sales because it measures signed contracts on existing homes, which represent around 90% of the market.
What’s the bottom line? Lawrence Yun, chief economist for the National Association of REALTORS® (NAR), explained, “The presence of multiple offers implies that housing demand is not being satisfied due to lack of supply. Homebuilders are ramping up production and hiring workers.” Quite simply, if there were more homes listed for sale, we’d have a much higher rate of signed contracts.LHome Prices Turning Higher

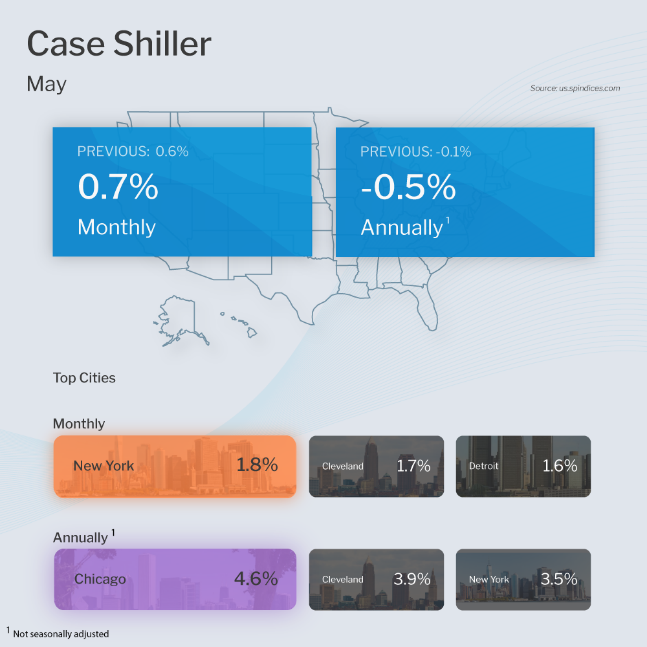
The Case-Shiller Home Price Index, which is considered the “gold standard” for appreciation, showed home prices nationwide rose 0.7% from April to May after seasonal adjustment, marking the fourth consecutive month of accelerating gains. Prices were 0.5% lower when compared to May 2022, though this is partly because home prices rose much more sharply in the first half of 2022 than they have so far this year.
The Federal Housing Finance Agency (FHFA) also released its House Price Index, which revealed that home prices rose for the fifth straight month, up 0.7% from April to May. Prices also rose 2.8% from May 2022 to May 2023.
Note that FHFA’s report measures home price appreciation on single-family homes with conforming loan amounts, which means it most likely represents lower-priced homes. FHFA also does not include cash buyers or jumbo loans, and these factors account for some of the differences in the two reports.
What’s the bottom line? “The rally in U.S. home prices continued in May 2023,” explained S&P DJI Managing Director Craig J. Lazzara, who added that “the ongoing recovery in home prices is broadly based.” The latest numbers from Case-Shiller and FHFA follow the strong home price growth that has also been reported by CoreLogic, Zillow and Black Knight in their respective indexes. The data combined shows that home prices are clearly moving upward. While this is encouraging for homeowners, shelter cost is a large component of inflation. Continued home price appreciation is one of the contributing factors to our concern of inflation bottoming, rather than continuing to decline.
What to Look for This Week
Look for important updates on the labor sector starting Tuesday with news on job openings via the JOLTS report for June. Wednesday brings ADP’s Employment Report for July, which measures private payrolls while the latest Jobless Claims will be reported on Thursday. The biggest headline comes Friday with July’s Jobs Report from the Bureau of Labor Statistics, which includes Non-farm Payrolls and the Unemployment Rate.
Technical Picture
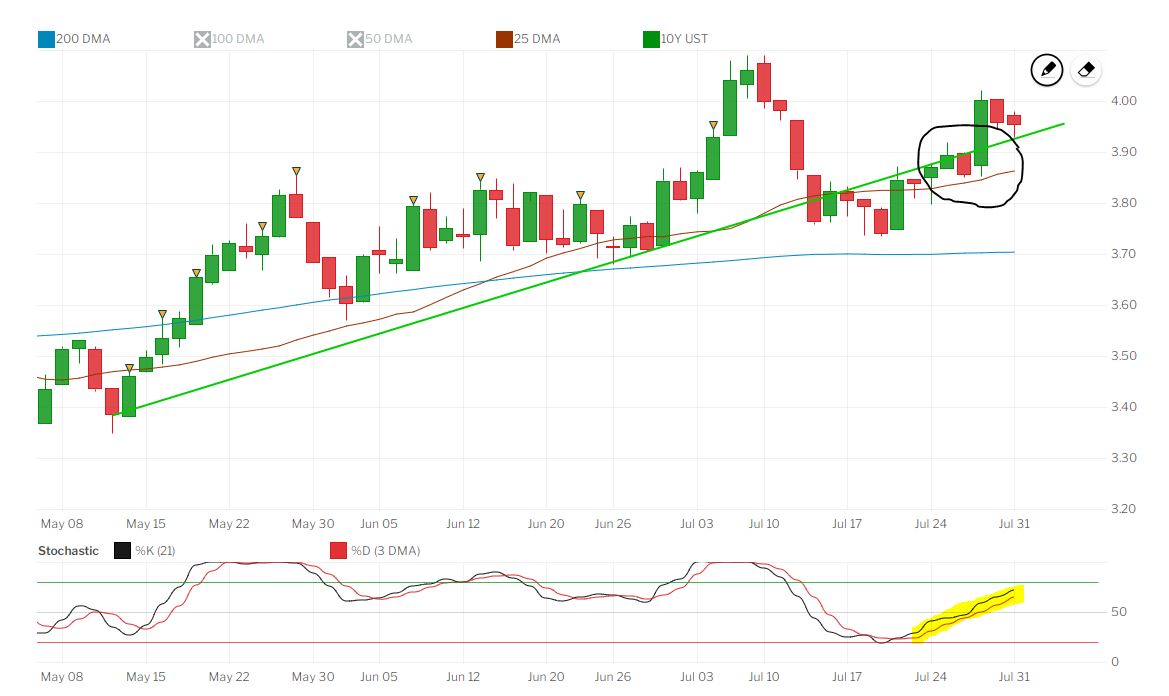
In last week’s update, we suggested that if the 10-year treasury yield was able to move back above the established trend it would likely touch 4% in a hurry. That is exactly what happened. Yield has now fallen back to the trend-line closing trading Monday at 3.95%. In technical analysis this type of move back to the significant trend is expected, after retesting the importance of the established trend, we expect the yield to move higher and test previous highs. The stochastic momentum indicator provides more evidence as it is pointed higher not yet “overbought”. We would expect the yield on the closely watched 10-year treasury to move higher towards 4.1% in the coming days/weeks.

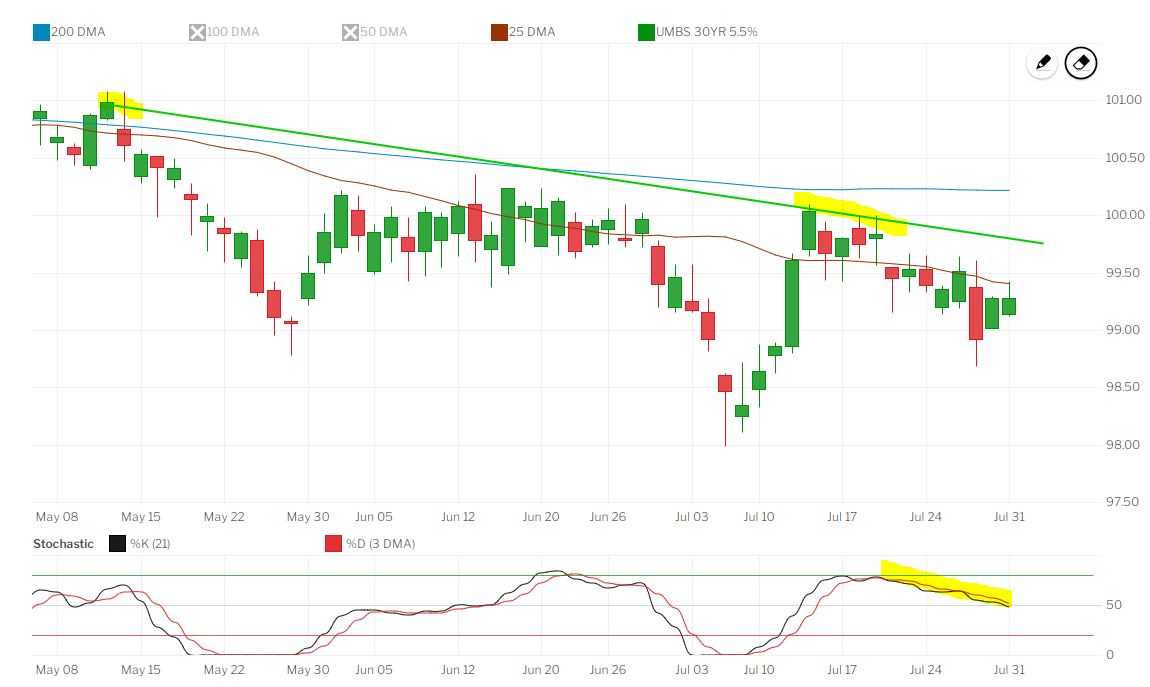
Mortgage Backed Securities (MBS) tell a similar story. Remember MBS are charted in price, which is inverse to rate. A lower MBS price means a high mortgage rate. MBS is clearly in a downtrend, defined as a series of lower highs and lower lows. We would expect MBS to move to retest lows made earlier in July as the 10-year treasury moves to test it previous highs. The MBS stochastic momentum indicator provides further evidence of this.

What’s the bottom line? We are expecting the 10-year treasury to remain locked in the trading range we have identified, between 3.7% - 4.1%. This means we expect mortgage rates to also remain locked in the range we’ve observed throughout the year, high 6% - low 7% on most conforming loan products. We will be watching incoming data closely, including the market's expectations for further Fed rate increases. Not only do we expect another rate increase this year, we believe it will be necessary. The economy remains resilient and inflation, in our view, has not been slayed, lag effects notwithstanding.
* Specific loan program availability and requirements may vary. Please get in touch with your mortgage advisor for more information.
