-
Week of August 28, 2023 in Review
In this week’s update:
Non-Farm Payroll Report
Pending Home Sales Rise for Second Straight Month
Strong Home Price Growth Continues
Technical Analysis – Rates Approach Critical Levels
August BLS Non-Farm Payroll Report
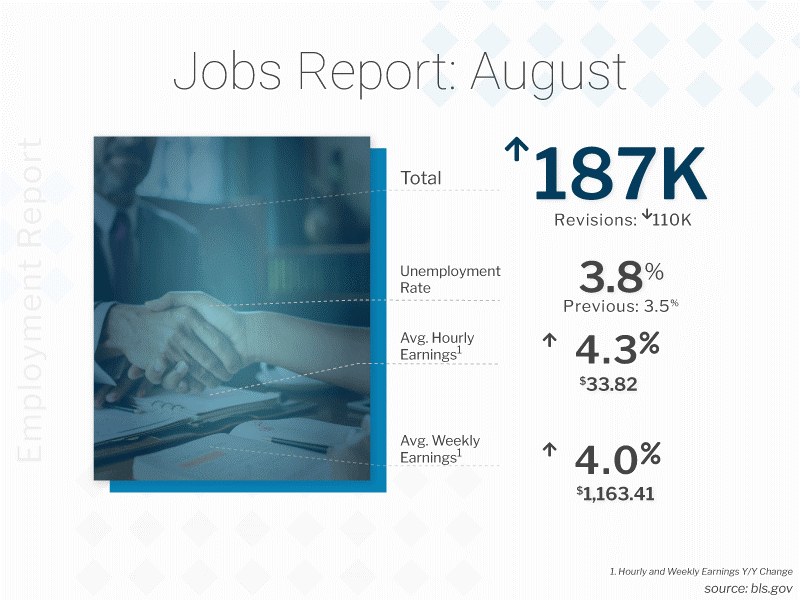
The Bureau of Labor Statistics (BLS) reported that there were 187,000 jobs created in August. While this was slightly better than estimates, job growth in June and July was revised lower substantially, subtracting 110,000 jobs in those months combined. The unemployment rate also rose from 3.5% to 3.8%, as a result of more adults entering the workforce.
What’s the bottom line? Job gains may be showing some signs of slowing, with the last three months averaging just 150,000 new jobs per month.
Job growth also continues to be revised lower in subsequent reports. For example, June’s originally reported number of 209,000 new jobs has been cut in half to just 105,000 jobs (which is the lowest reading in almost three years). However, historically August tends to be revised upward. August’s forthcoming revision may offset some of those net losses due to revisions.
The Fed has been looking for signs that the labor market is softening as they consider further rate hikes. Will this report be enough to convince them to pause at their next meeting? We’ll find out on September 20.
Pending Home Sales Rise for Second Straight Month
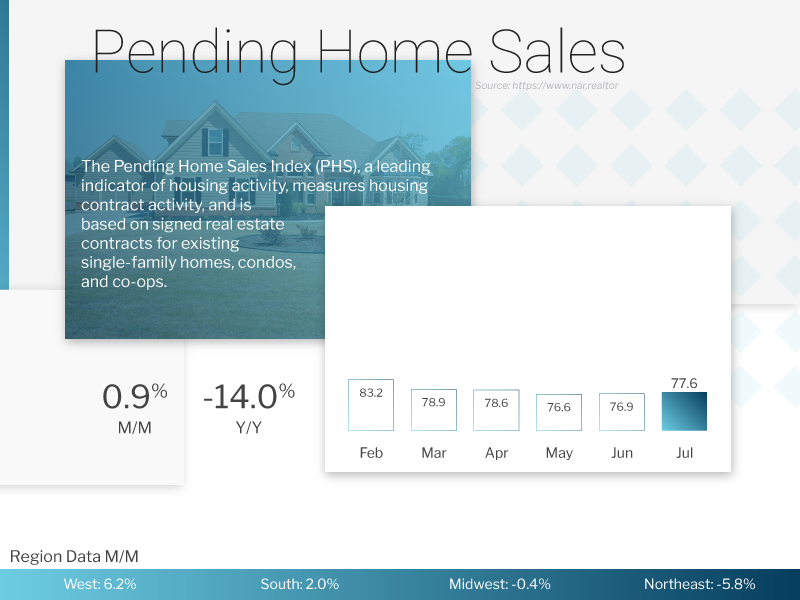
estimates of a 0.6% drop. While sales were down 14% from a year earlier, this is not from a lack of demand but a lack of inventory, which was nearly 15% lower over the same period. Pending Home Sales measure signed contracts on existing homes, which represent the largest segment of transactions, making this a crucial measure for taking the pulse of the housing market.
What’s the bottom line? This was the second monthly increase in a row and shows strength in the housing sector, especially considering that July saw elevated mortgage rates and historically tight inventory. Lawrence Yun, chief economist for the National Association of REALTORS® (NAR), noted that “the small gain in contract signings shows the potential for further increases in light of the fact that many people have lost out on multiple home buying offers.”
Strong Home Price Growth Continues
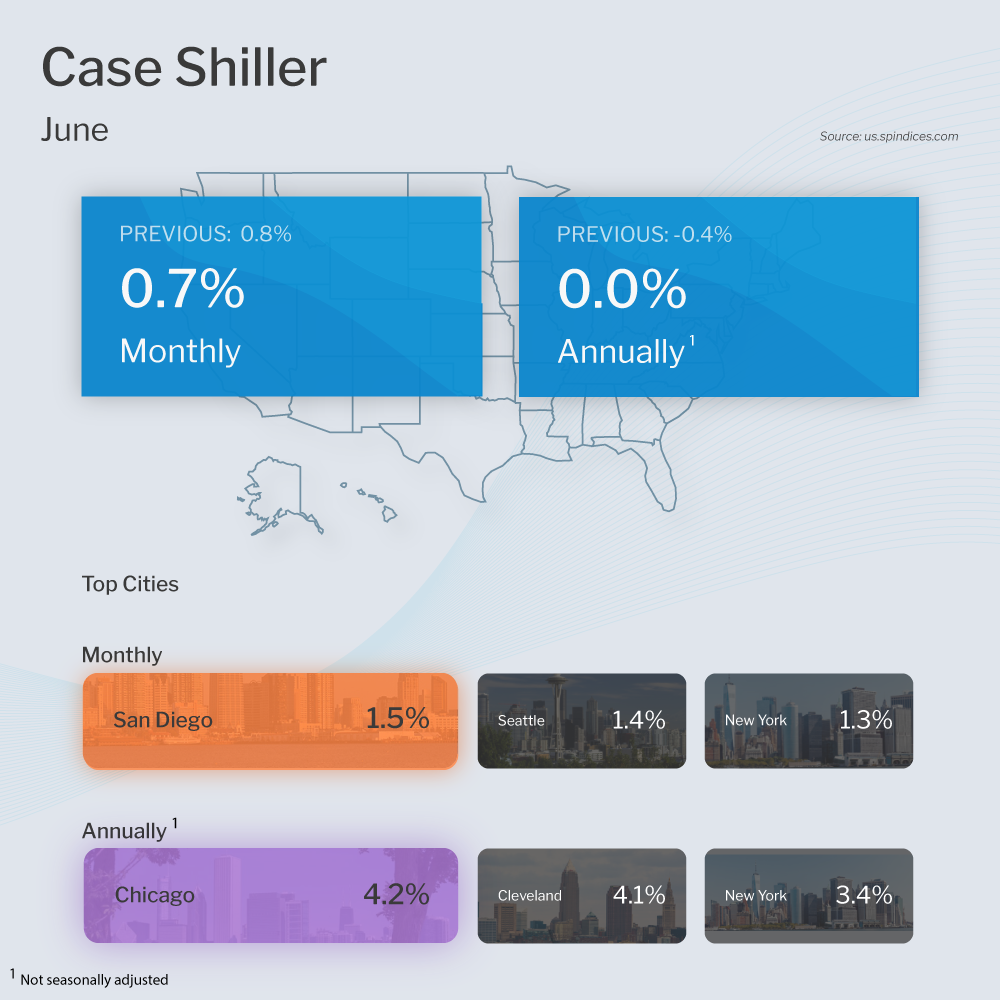
ZThe Case-Shiller Home Price Index showed home prices nationwide rose 0.7% from May to June after seasonal adjustment, marking the fifth consecutive month of gains. Prices were flat when compared to June 2022, which was when prices peaked in this report.
The Federal Housing Finance Agency (FHFA) also released its House Price Index, which revealed that home prices rose for the sixth straight month, up 0.3% from May to June. Prices also rose 3.1% from June 2022 to June 2023.
Note that FHFA’s report measures home price appreciation on single-family homes with conforming loan amounts, which means it most likely represents lower-priced homes. FHFA also does not include cash buyers or jumbo loans, and these factors account for some of the differences in the two reports.
What’s the bottom line? Home values are setting new all-time highs according to FHFA, CoreLogic, Black Knight, and Zillow, more than recovering from the downturn we saw in the second half of 2022.
Technical Picture
We continue to be concerned at the idea of a resurgence in inflation. As we have written for several months, base effects are set to work against the month-over-month trend lower in inflation as measured by CPI. Supporting the idea of a resurgence in inflation, the cost of a barrel of crude oil is nearing $90 as of the time of publication.
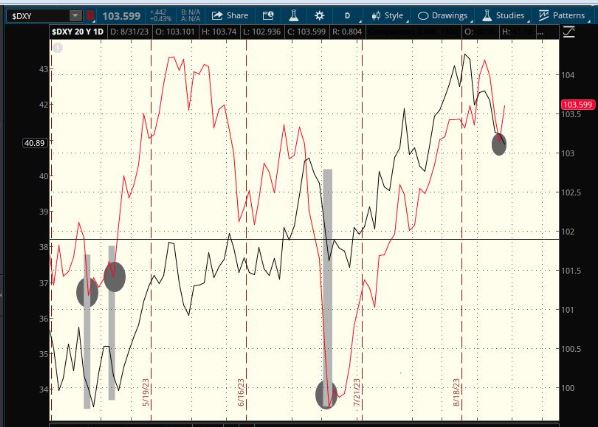
We pointed out last week the strong relationship between the U.S. Dollar and the 10-year treasury. As of late the USD (charted using DXY) has been leading the 10-year treasury yield (TNX) higher and lower throughout 2023. Last week we noticed the US Dollar rallying, and based on recent history warned that treasury yields would follow.
Technical Picture
After pulling back from 4.8%, the 10-year treasury yield has held its uptrend. As long as this trend is maintained, I wouldn’t be surprised to see a retest of 4.8%. What we will be watching for is whether or not a new high yield is achieved on the next run-up.
That follow-through is occurring today as the 10-year treasury is up 9bps.
As you might suspect, after some improvement last week, mortgage backed securities (MBS) are have reversed to move lower. The move lower in MBS price is pushing mortgage rates higher once again. Much like the 10-year, I suspect we will retest previous lows, from there a more clear picture will likely emerge.
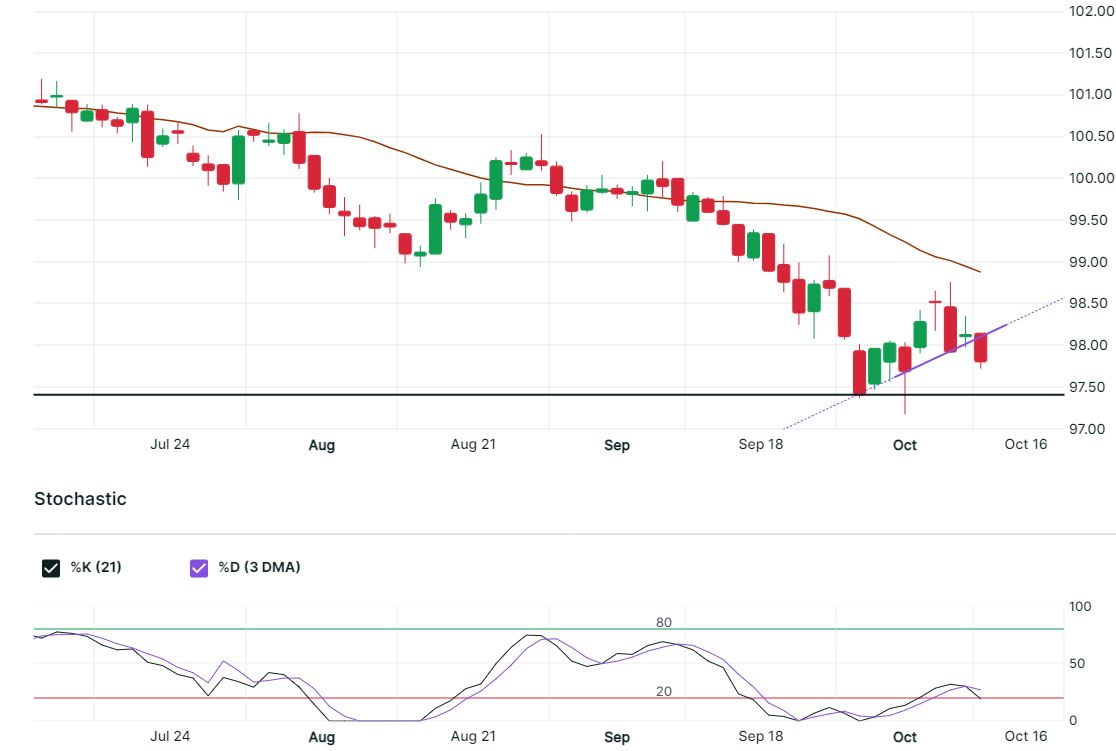
To that end, we are very concerned that the 10-year treasury may be gathering momentum to break through the 4.33% level which we have identified repeatedly as a critical level.
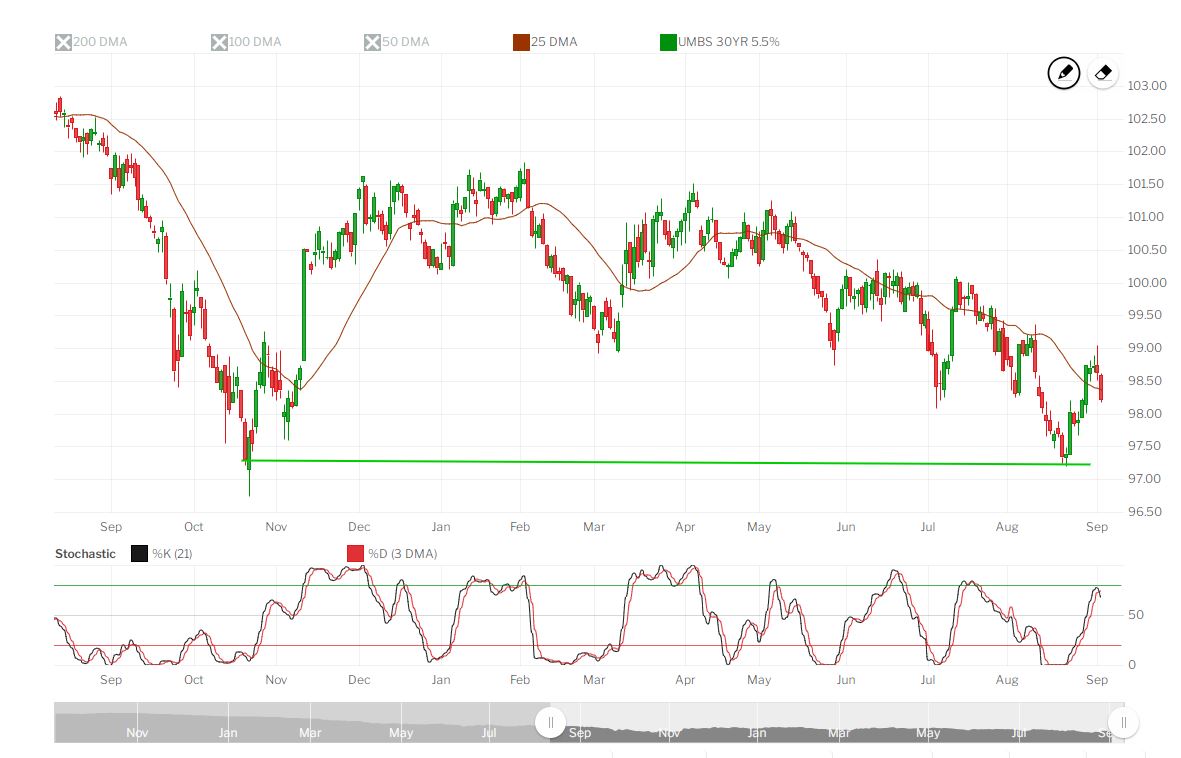
What’s the bottom line? The 90 days ahead will be incredibly important for setting the table for the first half of 2024. If we see inflation begin to poke its head back up, and the Fed acts to raise rates 1 or 2 more times this year, that would have both long-term and short-term implications for mortgage rates, and it may prove to be counterintuitive. We suspect that if we see the Fed raise rates it will provide downward pressure on mortgage rates, particularly if we see two more hikes this year. In the short-term, weeks to months, we see the most risk to the upside on rates. We will continue to watch the strength of the U.S. Dollar to help us guide our opinion of the direction of mortgage rates.
* Specific loan program availability and requirements may vary. Please get in touch with your mortgage advisor for more information.

