-
Fed Chair Jerome Powell gave hints about further rate hikes during his speech at Jackson Hole. Plus, the lack of existing homes available for sale continues to be a key factor driving the housing sector. Read on for these important stories:
Are Further Fed Rate Hikes Ahead?
Existing Home Sales Constrained by Low I
nventory
New Home Sales Reach 17-Month High Tame Unemployment ClaimsAre Further Fed Rate Hikes Ahead?
Fed Chair Jerome Powell spoke last Friday at the annual Jackson Hole Symposium, which is a gathering of economists, central bankers, and policymakers from around the world. While Powell acknowledged that progress has been made in the fight against inflation, his comments were relatively hawkish (hawks are policymakers who favor higher interest rates to keep inflation in check).
Powell said, “Although inflation has moved down from its peak – a welcome development – it remains too high. We are prepared to raise rates further if appropriate and intend to hold policy at a restrictive level until we are confident that inflation is moving sustainably down toward our objective.”
What’s the bottom line? Remember, the Fed has been hiking its benchmark Fed Funds Rate (which is the overnight borrowing rate for banks) to try to slow the economy and curb inflation. Their latest hike in July was the eleventh since March of last year, pushing the Fed Funds Rate to the highest level in 22 years. Powell said that the Fed will proceed carefully in upcoming meetings as they assess incoming data and the evolving outlook and risks.
Powell also reiterated that the Fed's inflation goal is still 2% and that he sees the current economic stance as restrictive, putting downward pressure on economic activity, hiring, and inflation.
Existing Home Sales Constrained by Low Inventory
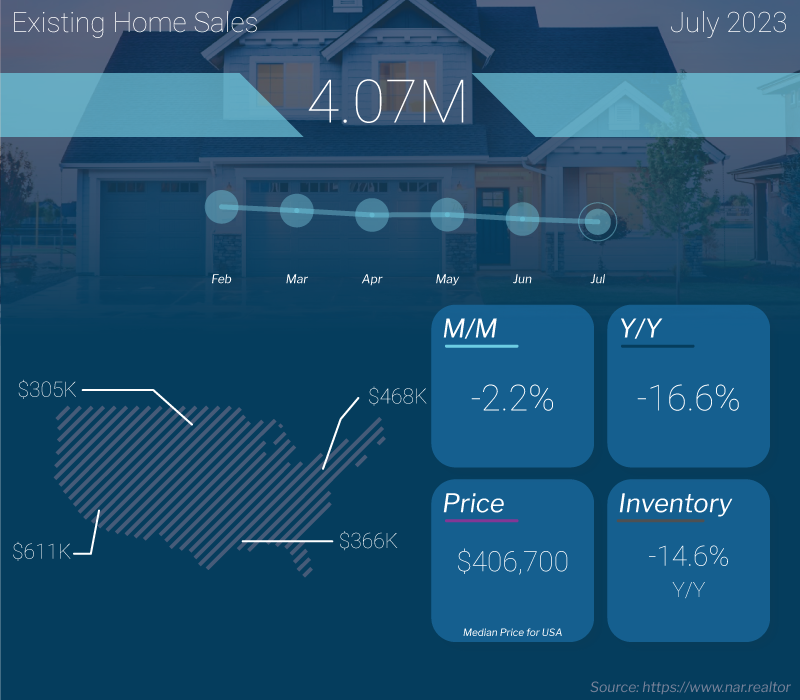
Existing Home Sales fell 2.2% from June to July to a 4.07-million-unit annualized pace, per the National Association of REALTORS® (NAR). Sales were also 16.6% lower than they were in July of last year. This report measures closings on existing homes, which represent a large portion of the market, making it a critical gauge for taking the pulse of the housing sector.
What’s the bottom line? While inventory levels increased 3.7% last month, from 1.07 million units in June to 1.11 million units available at the end of July, housing supply was still well below normal levels with just 3.3 months’ worth of inventory available at the current sales pace.
NAR’s Chief Economist Lawrence Yun confirmed that the lack of inventory is a key factor constraining sales activity this summer. Yet demand remains for homes, as evidenced by how quickly correctly priced homes have been selling. Homes stayed on the market on average for 20 days last month, while 74% of homes sold in July were on the market for less than a month.
New Home Sales Reach 17-Month High
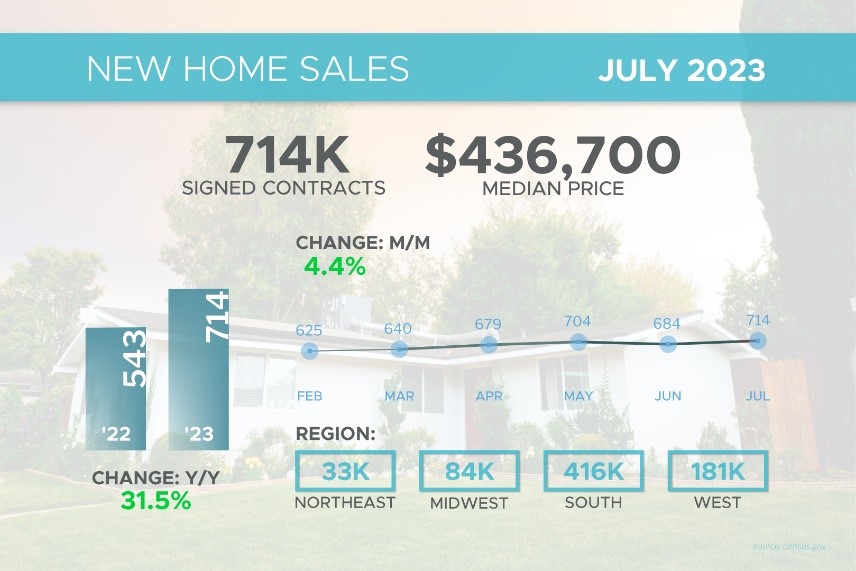
New Home Sales, which measure signed contracts on new homes, rose 4.4% from June to July to a 714,000-unit annualized pace. This reading was better than expected and the highest amount since February of last year.
What’s the bottom line? The lack of existing homes for sale is heightening the demand for new homes, but the available supply of new construction remains below healthy levels. Of the 437,000 new homes available for sale at the end of July, only 75,000 were completed, with 254,000 under construction and 108,000 not even started yet.
The tight supply of both existing and new homes will continue to be supportive of home prices.Tame Unemployment Claims
New Home Sales, which measure signed contracts on new homes, rose 4.4% from June to July to a 714,000-unit annualized pace. This reading was better than expected and the highest amount since February of last year.
What’s the bottom line? The lack of existing homes for sale is heightening the demand for new homes, but the available supply of new construction remains below healthy levels. Of the 437,000 new homes available for sale at the end of July, only 75,000 were completed, with 254,000 under construction and 108,000 not even started yet.
The tight supply of both existing and new homes will continue to be supportive of home prices.
Tame Unemployment Claims
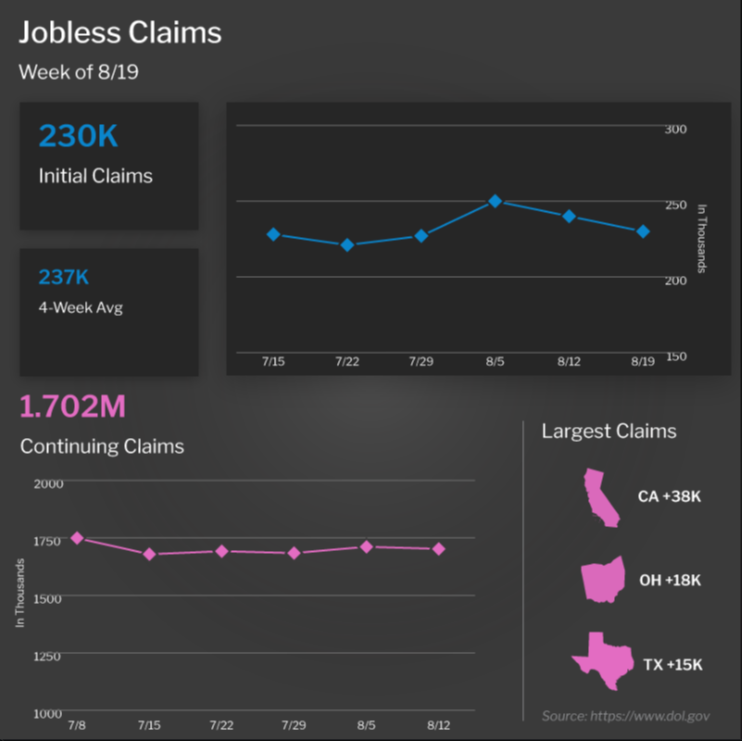
Initial Jobless Claims fell by 10,000 in the latest week, as 230,000 people filed for unemployment benefits for the first time. Initial Claims have remained relatively tame after topping 260,000 for the first three weeks of June, which suggests that employers are trying to retain their workers and firings have been muted.
Meanwhile, Continuing Claims declined by 9,000, with 1.7 million people still receiving benefits after filing their initial claim. This figure has been vacillating around this range for much of the summer after hitting a high of 1.861 million in early April. The trend lower reflects a mix of people finding new jobs and benefits expiring.
As noted above, employment data will play a big role in the Fed’s next rate hike decision, which will be announced at their meeting on September 20.
What to Look for This Week
The markets will be busy ahead of the Labor Day weekend. In housing news, we’ll see an update on home price appreciation for June when the Case-Shiller Home Price Index and the Federal Housing Finance Agency House Price Index are reported on Tuesday. July’s Pending Home Sales follow on Wednesday.
Job market data will also grab headlines, starting Wednesday with an update on August’s private payrolls in ADP’s Employment Report. The latest Jobless Claims will be reported on Thursday while Friday brings August’s Jobs Report from the Bureau of Labor Statistics, which includes Non-farm Payrolls and the Unemployment Rate.
In addition, the second estimate for second-quarter GDP will be released on Wednesday, while a crucial inflation reading will be delivered on Thursday via the Fed’s favored measure, Personal Consumption Expenditures.
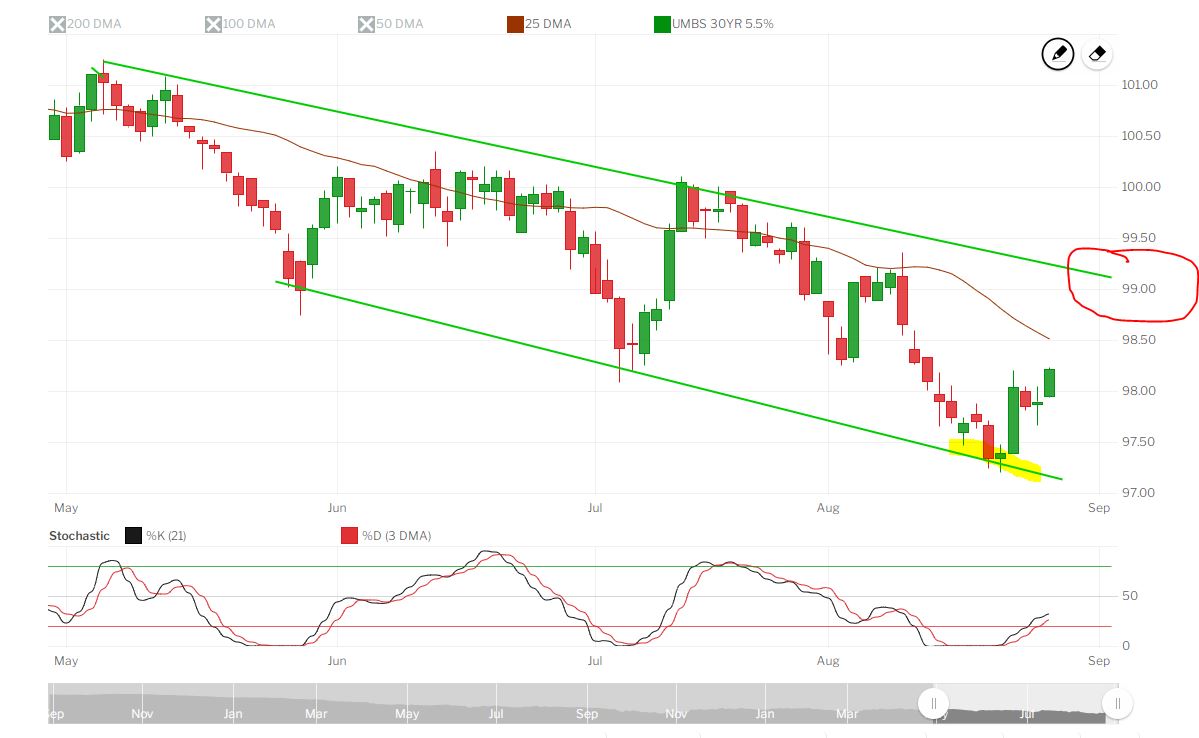
Technical Picture
The 10-year Treasury yield continues to trade near recent highs. As we have written many times 4.33% is a key level for the 10-year Treasury yield. A sustained break above this level could lead to the 10-year yield moving as high as 5.4% in the months ahead. So far, 4.33% has served as resistance. Employment, and inflation statistics through the fall of this year will play a key role in determining the path of the 10-year treasury yield.
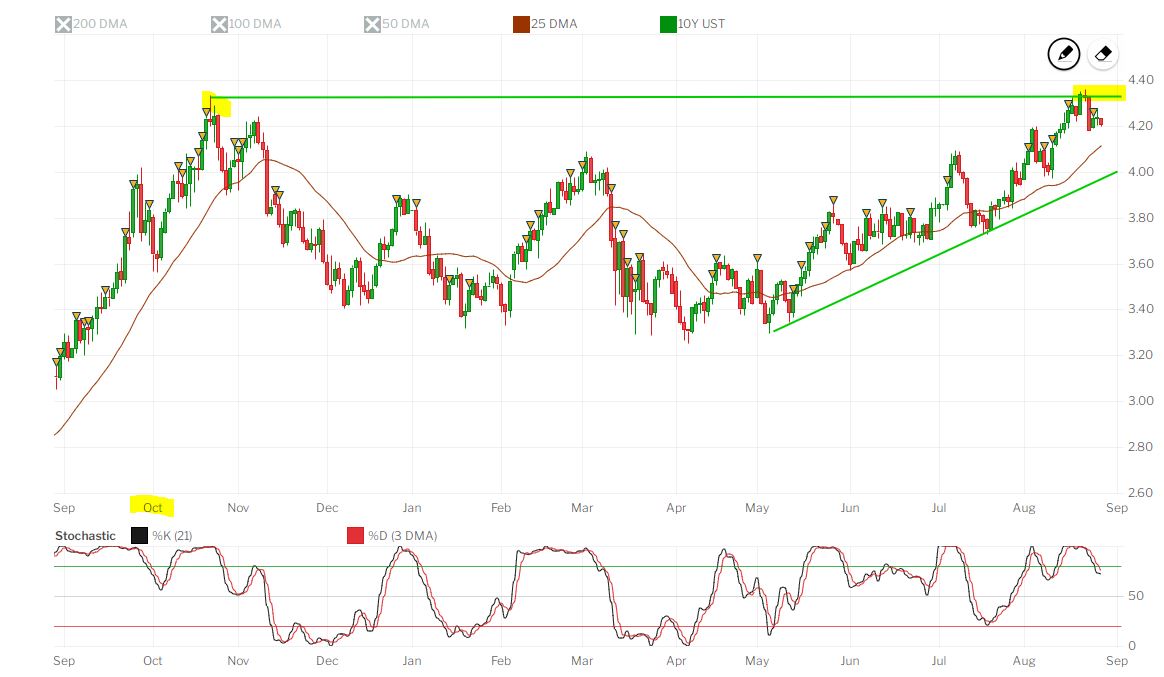
Mortgage-backed securities (MBS) ended last week at the low point of an established channel. Remember, MBS are charted in price, which is inverse to yield. A lower price equals a higher yield. There is a strong possibility that we see MBS trade back to the top of the channel, which would bring some relief to most mortgage rates, and would likely coincide with the 10-year falling to an area close to 4%.
What’s the bottom line? The idea of “higher for longer” is really starting to sink in. The Fed has once again reaffirmed its commitment to the 2% inflation target. Markets are continuing to push out in time the expectations of rate cuts. It wasn’t too long ago that markets were expecting rate cuts in Q4 of this year, now the earliest expectations have the Fed cutting rates Q3 of 2024. While that seems somewhat reasonable, we also concede that things can change in a hurry. If the economy begins to show pronounced signs of weakness, or some unexpected geo-political event occurs this could happen sooner. Alternatively, if the economy continues to show signs of strength, employment remains resilient, and the consumer keeps spending we may see the Fed push rates even higher. * Specific loan program availability and requirements may vary. Please get in touch with your mortgage advisor for more information.